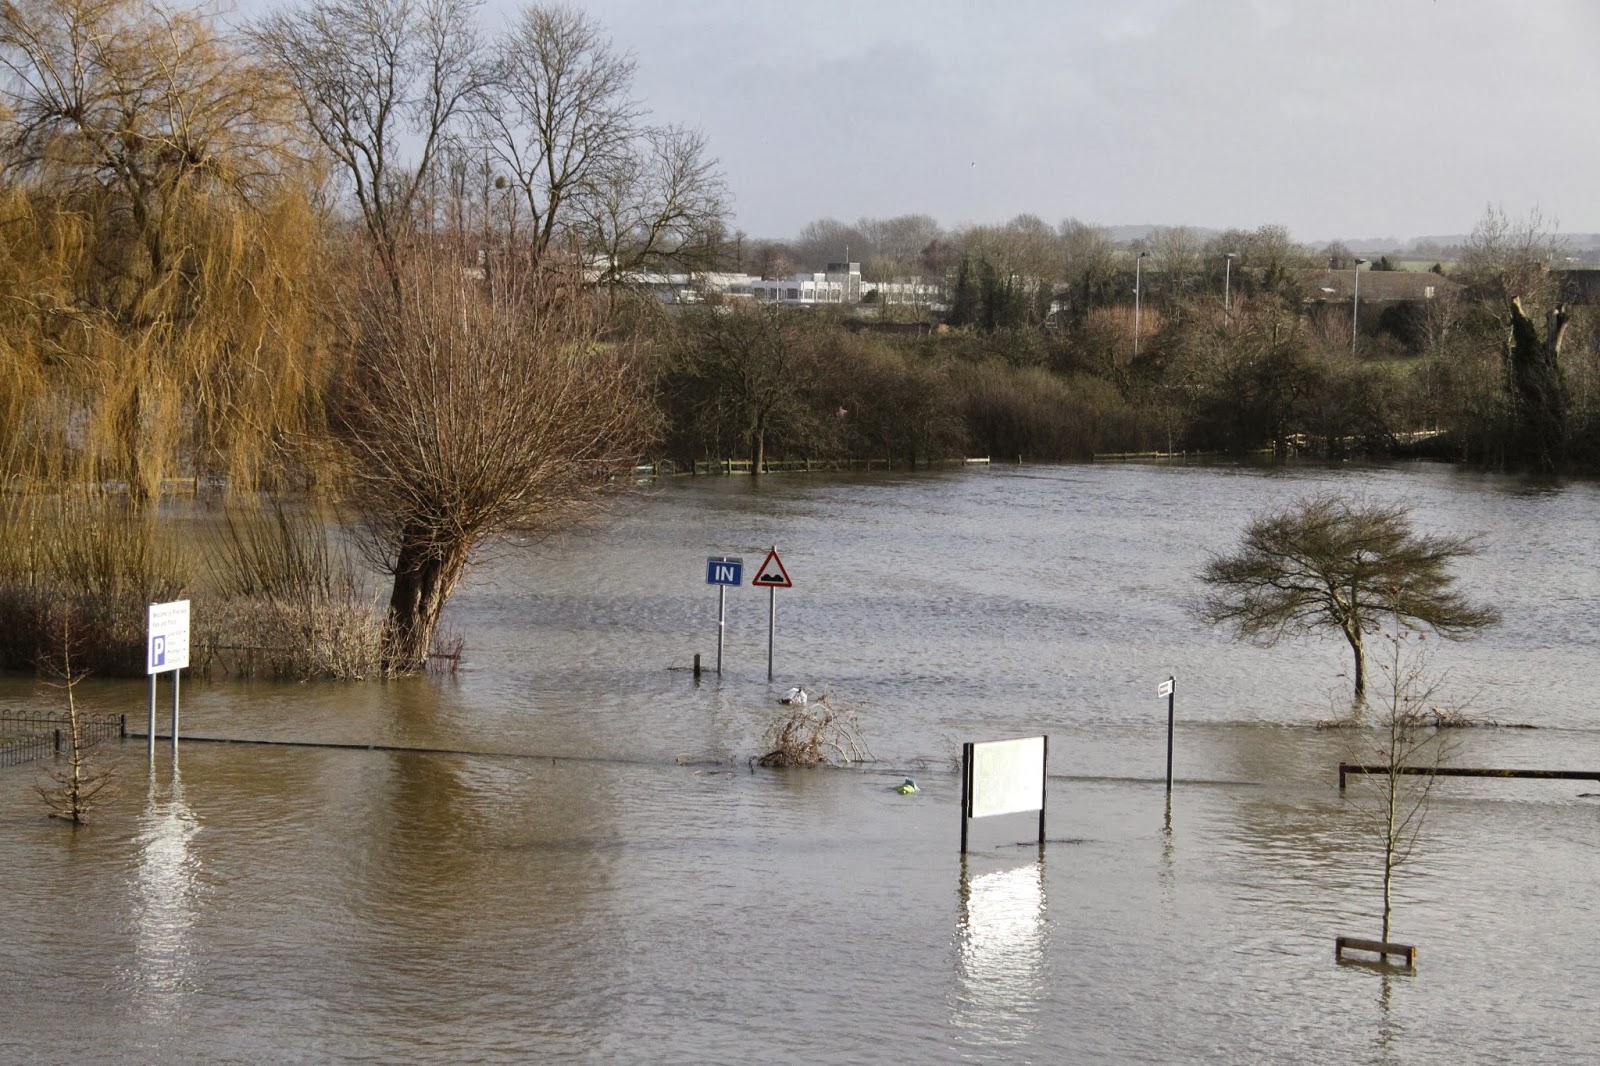
Showing posts with label Wallingford. Show all posts

Monday, 17 March 2014

Winter 2013/14 rainfall records at CEH's Wallingford meteorological station

Katie Muchan, a hydrologist with the Centre for Ecology & Hydrology, looks at the 2013/14 winter rainfall totals recorded at CEH's meteorological station at Wallingford, Oxfordshire.

The news for the last three months has been dominated by record rainfall and prolonged flooding. It was the wettest winter for England & Wales since records began in 1766; and in south-east England, 2013/2014 winter rainfall in both the Thames and Southern regions was more than 230% of the average. The story for the meteorological station based at CEH’s Wallingford site has been no different, with several rainfall records broken during the winter of 2013/2014.

Daily temperature, rainfall and sunshine have been recorded at the meteorological station at the Wallingford site since 1962, in addition to observations of cloud cover, present weather and visibility. The persistence of the storms through the winter of 2013/2014 can be seen in the daily rainfall data. Once the storms started on 15 December 2013, rainfall was recorded on 73 of the 76 remaining days of winter. Furthermore, 66 of these 76 days can be classed as a rain-day, defined as a day when at least 0.2mm rainfall is recorded.

Daily rainfall (mm) during winter 2013/2014 at CEH's Wallingford meteorological station

December started dry, with only 2mm of rainfall recorded in the first two weeks. However, following the first storm on the 15th, rainfall was recorded on all but one day for the rest of the month and the most notable storm, on the 23rd, recorded a daily rainfall total of 35.5mm (36% of the monthly total). This made it the wettest day of the year, and also the wettest day since 22 August 2010. Due to the dry start to the month, December 2013 rainfall was not record-breaking, but it was the fifth wettest in the station’s history, with a monthly total of 97.9mm.

The persistent rain continued into January; only two days recorded no rainfall. As a result, January was the wettest of the winter months; the monthly total of 148.4mm broke the previous January record by 30mm (~25%). January 2014 was also the third wettest of any month at the station in the record from 1962, behind August 1977 and October 1966.

February is normally the driest month of the year with an average monthly total of 37.5mm. However, with rain falling every day in February 2014, yet another record was broken. The monthly total of 112.9mm is 302% (i.e. three times) the average, making it the wettest February in the station’s history (beating the previous record of 103.3mm in 1990).

*Previous records are quoted based on data for January 1962 - November 2013

While the individual monthly totals and records are impressive in themselves, the accumulation of rainfall across the winter season also produces some record-breaking figures. The rainfall total of 246.3mm in December 2013 and January 2014 set a record for the wettest two-month accumulation of any in the station's history, only to be broken by the rainfall in January and February 2014, which totalled 261.3mm. On 13 February, with 15 days of winter remaining, the record for the wettest winter set in 1989/1990 (311.5mm) had already been broken. Rain continued throughout the rest of the month, giving a 2013/2014 winter total of 359.2mm, breaking the previous record by 47.7mm.

Winter rainfall totals (mm) at CEH's Wallingford Meteorological Station


Katie Muchan

Additional information


More information on CEH's Wallingford meteorological station

Hydrological Summaries published during winter 2013/14, including the February 2014 Hydrological Summary

A joint Met Office and CEH report on the winter storms and floods was published in February.

Monday, 6 January 2014

An interim update on the UK's hydrological situation

Terry Marsh, the leader of the National Hydrological Monitoring Programme* at CEH, has just sent us an interim update on the UK's hydrological situation. The information below adds to the detail in our most recent Hydrological Summary for the UK (for November 2013). The next monthly summary will be published on or before 15 January 2014.

Please note that the text is necessarily provisional because we are awaiting the latest flow figures before confirming the rarity of the current flooding episode. For the latest information on flooding in your area, please visit the Environment Agency website.

UK hydrological summary - 6 January 2014

A vigorous Jet Stream has brought a succession of moisture-laden Atlantic low pressure systems across the UK. Their impact has been exacerbated by high tides and strong winds. Tidal ‘blocking’ of river outflows has been a significant factor in coastal flooding.

Saturated catchment conditions over the last six weeks have meant that even moderate rainfall has increased flood risk, particularly recently when most rivers have been flowing close to bankfull.

Flood levels at Wallingford bridge on 9 January 2014
when they were approaching the 2003 marker.
Photo: Heather Lowther / Centre for Ecology & Hydrology


Examples of all flood categories: fluvial, pluvial (flash), tidal and groundwater have been reported in late 2013/early 2014.

Fluvial flooding has occurred in most river basins across the country and outflow (total river flows) from England & Wales has been exceptionally high - we are awaiting figures but recent daily totals are likely to be the highest since the late 2000 floods (and possibly amongst the highest since 1947).

However, whilst floodplain inundations have been extensive and sustained, extreme flow events in individual rivers have been relatively uncommon (the relatively even distribution of the rainfall and the speed of passage of the low pressure systems are key factors in this spatial distribution).

Flood defences have generally performed well. Most flooding of property, to date, has been on sites constructed on floodplains or low-lying coastal locations. The most damaging flooding is normally local or regional in extent (the summer floods of 2007 in Yorkshire and South/Central England and the July/Sept floods of 1968) being examples of regional flooding. Recent weeks are most notable for the wide areal extent of notably high flows rather than record runoff in individual rivers.

Floodplain inundations have been extensive.
Photo: Paulette Burns / Centre for Ecology & Hydrology


None of the flooding in the last 50 years matches that experienced in March 1947 when a warm front brought moderate rainfall and a rapid increase in temperature which melted snow accumulations of >30cm across much of England & Wales. At that time, flood defences were rudimentary. Such floods are less likely to occur in a warming world and, although the frequency of high flows has increased in the last 50 years, there is no compelling long-term trend in annual maximum flows for UK rivers.

However, with sea levels rising (exacerbated by isostatic re-adjustment in some regions), the type of fluvial/tidal flooding recently experienced may be expected more frequently in the future.  

With regard to the UK’s Water resources (which supply water for household and industrial use) the rainfall in December and early January has ensured that reservoir stocks are above average across almost all of the UK and groundwater levels have generally risen rapidly over the last six weeks. The water resources outlook for 2014 is therefore very healthy.

Terry Marsh, Centre for Ecology & Hydrology, 6 January 2014

Additional information


Key floods publications from CEH

Report - The 2010-12 drought and subsequent extensive flooding [PDF]
The section from pages 44-47 covers recent decades in the context of long-term trends for rainfall, runoff (river flows) and groundwater levels.

Report - The Summer 2007 floods in England and Wales [PDF]

Report - The 2000/2001 floods

Briefing Note - Understanding Floods [PDF]

Related links

CEH Blog: Rainfall, UK floods and the potential impacts of climate change?

Flickr: Photos of January 2014 flooding in Wallingford, Oxfordshire


*The National Hydrological Monitoring Programme (NHMP) aims to provide an authoritative voice on hydrological conditions throughout the UK, to place them in a historical context and, over time, identify and interpret any emerging hydrological trends. Such information is essential for improved water management strategies and its dissemination helps to increase public understanding of hydrological and water resources issues.

This is accomplished through regular monthly and annual bulletins, occasional reports on floods and droughts, and engagement with the media. Hydrological analysis and interpretation within the programme is based on the data holdings of the National River Flow Archive and National Groundwater Level Archive, including rainfall, river flows, borehole levels, and reservoir stocks.

The NHMP is run with the cooperation of the principal Measuring Authorities of the Environment Agency (England), Natural Resources Wales, the Scottish Environmental Protection Agency, and the Rivers Agency (Northern Ireland).

Amongst the NHMP outputs are:


NB: This post was edited on 9 January 2014 to include a new photograph of the flood level mark at Wallingford Bridge. All photos indicating the rising flood levels are available on our Flickr set.

Rainfall, UK floods and the potential impacts of climate change?

Water is again much in the news this week with widespread flooding across the UK following several weeks of very stormy weather. It's been a difficult time for many homeowners, particularly those by the coast, and the emphasis is now shifting to those living adjacent to several of our major river systems.

Yesterday (Sunday 5 January 2014), the Environment Agency published a news story naming the Thames, Dorset Stour and Frome, Somerset Levels, 'rivers' in the South East and the Severn as rivers where the flood threat remains into next week as larger rivers start to reach their peak.

Flooding on the river Thames at Wallingford, Oxfordshire January 2014


CEH has already had calls from a number of journalists asking if the current weather and flooding patterns are anything out of the ordinary. CEH science and the data archives we host play a key role in informing the UK's operational agencies during this type of event. Within CEH we have teams of scientists working on furthering our understanding of hydrological processes, water resources, water information management, hydrological status and reporting, the climate system, hydrological modelling and risk, and hydrological modelling and forecasting.

A few examples include:

The Centre for Ecology &  Hydrology jointly operates the National Hydrological Monitoring Programme (for the UK) in conjunction with the British Geological Survey. NHMP scientists produce the UK Monthly Hydrological Summary which assesses rainfall, river flows, groundwater and reservoir levels. They also operate the UK's National River Flow Archive. The NHMP also has a remit to analyse major flood and drought events in the UK and analyse long-term trends in UK hydrological data. The team publish a series of occasional reports on major hydrological events, including reports on the UK's major flood events in 2000/2001, 2007 and 2012.

The UK's Monthly Hydrological Summary is published on, or before, the tenth working day of the following month. A Hydrological Outlook for the UK is also available.

CEH's Grid-to-Grid (G2G)*, which is now used as the main hydrological model underpinning flood warning and forecasting by both the Environment Agency / Met Office Flood Forecasting Centre for England & Wales and the SEPA / Met Office Scottish Flood Forecasting Service for Scotland.

In 2012 CEH staff concluded a major project looking at "Future Flows and Groundwater Levels: British projections for the 21st century". The research looked at the impact of climate change on river flows and groundwater levels across England, Wales and Scotland and produced two unique datasets, which are now available via the CEH website, through the CEH Information Gateway and downloadable from the National River Flow Archive and National Groundwater Archive.

And finally on Friday 3 January, CEH climate scientist Chris Huntingford wrote this piece for the Guardian: "We desperately need to predict what climate change is doing to UK rainfall".

Additional information


* The Grid-to-Grid hydrological model is a tool developed by the Centre for Ecology & Hydrology (CEH) for translating rainfall into river flows to predict potential river flooding. Intensive work on the Grid-to-Grid project began in 2002 at CEH and continues today in collaboration with the Environment Agency. Total NERC investment in the project (via CEH) is estimated at £1.2 million with additional funding provided by other organisations.

Further links

Jamie Hannaford from the Centre for Ecology & Hydrology contributed a chapter to the Living with Environmental Change climate change report card for water entitled, "Observed long-term changes in UK river flow patterns: a review"

More photos of the flooding at Wallingford, Oxfordshire (January 2014) on our Flickr photostream