Showing posts with label flood level. Show all posts

Sunday, 9 February 2014

Record breakers? Climate change, statistics and the recent UK floods

This morning the Met Office and the Centre for Ecology & Hydrology released a report on the recent storms and floods in the UK.

You can read the full report here, and a short summary of the hydrological analysis on our website here

The report documents the recent record-breaking weather and flooding episode, and discusses whether climate change contributed to the severity of the weather and its impacts. Climatology, meteorology and hydrology are covered in the report. 

In this blog post we highlight some of the hydrological conclusions that came from analysis of the long-term datasets held at CEH and our long history of research into floods.

With regard to the record-breaking nature of the flooding the report makes the following points:


  • The full gamut of flood manifestations – tidal, pluvial (flash), fluvial and groundwater – has been experienced over the last eight weeks.
  • The exceptional run of severe winter storms over December 2013 and January 2014 carried with them large amounts of rain which has led to very serious flooding across southern England. 
  • Estimated outflows (river flows) from Great Britain remained close to the highest ever recorded during late December and, subsequently, throughout most of January across large parts of England and Wales.
  • In a series from 1883, flows on the River Thames at Kingston (close to the tidal limit) remained above 275 m3 s-1 for longer than in any previous flood episode, and continue to exceed this threshold into early February. 
  • A preliminary analysis suggest that outflows aggregated over six weeks were the greatest since the 1947 floods – the most extensive in England & Wales during the 20th century.
  • In December and January, a few rivers (including the Mole, Wey and Medway, which, on the basis of preliminary data, recorded their highest flows since the extreme floods of September 1968) registered outstanding maximum flows. 
  • Generally, however, the peak flows registered during the recent flooding were not extreme. On the Thames the highest flow in 2014 has been exceeded during 14 earlier floods (most prior to 1950). 
  • The floodplain inundations across the UK caused major disruption to transport, agriculture and restricted sporting and recreational activities, and resulted in severe difficulties for some low-lying hamlets (most notably in the Somerset Levels). However, given the overall volume of runoff, the amount of property flooding at the national scale was relatively modest; a tribute to the general effectiveness of flood defences.


Figure 1: Combined flows (m3 s-1; black) for the Thames, Severn, Trent, Yorkshire Ouse and Usk in 2013 and January 2014, plotted against period of record (1969-2013) daily maximum flows (blue), daily minimum flows (pink) and daily mean flows (grey)

With regard to whether climate change has been a contributing factor to the current flooding the report states:


  • The cluster of drought and flood events through the early years of the 21st century and the recent runoff and recharge patterns, are near to the extreme range of historical variability, and therefore also raise the question that they may reflect anthropogenic climate change. It is important to note, however, that differing flood types may be expected to respond differently to increasing temperatures. Tidal flood risk is increasing as sea levels rise but the outlook is more complex in relation to fluvial flooding.
  • Published studies have observed increased river flows in the winter half-year and a tendency for higher flows to occur more frequently, and this has been reinforced in recent years. Importantly, however, such a trend may not be accompanied by any increase in magnitude of major flood events. In the UK, no positive trend in water-year maxima was found in the 130-year series for the Thames.
  • Enhanced groundwater flood risk may be expected if average winter rainfall in the UK increases. Flash flooding, which can be exacerbated by land management and land use practices (particularly the extension of impermeable areas), may also increase if the recent intensification in rainfall translates into an enduring trend. 
Much more detail can be found in the full report. More information about the report's conclusions is available on the Met Office website here.

Journalists can call our Press Office if more information is needed on the hydrological conclusions.

Barnaby Smith, CEH Media Relations Manager

Further links

Jamie Hannaford from the Centre for Ecology & Hydrology contributed a chapter to the Living with Environmental Change climate change report card for water entitled, "Observed long-term changes in UK river flow patterns: a review"


An interim update on the UK's hydrological situation - issued by CEH on 6 January 2014

Rainfall, UK floods and the potential impacts of climate change? - blog from 6 January 2014

NB: the Met Office updated the report on 11 February to give a more detailed assessment of sea level rise

Monday, 6 January 2014

An interim update on the UK's hydrological situation

Terry Marsh, the leader of the National Hydrological Monitoring Programme* at CEH, has just sent us an interim update on the UK's hydrological situation. The information below adds to the detail in our most recent Hydrological Summary for the UK (for November 2013). The next monthly summary will be published on or before 15 January 2014.

Please note that the text is necessarily provisional because we are awaiting the latest flow figures before confirming the rarity of the current flooding episode. For the latest information on flooding in your area, please visit the Environment Agency website.

UK hydrological summary - 6 January 2014

A vigorous Jet Stream has brought a succession of moisture-laden Atlantic low pressure systems across the UK. Their impact has been exacerbated by high tides and strong winds. Tidal ‘blocking’ of river outflows has been a significant factor in coastal flooding.

Saturated catchment conditions over the last six weeks have meant that even moderate rainfall has increased flood risk, particularly recently when most rivers have been flowing close to bankfull.

Flood levels at Wallingford bridge on 9 January 2014
when they were approaching the 2003 marker.
Photo: Heather Lowther / Centre for Ecology & Hydrology


Examples of all flood categories: fluvial, pluvial (flash), tidal and groundwater have been reported in late 2013/early 2014.

Fluvial flooding has occurred in most river basins across the country and outflow (total river flows) from England & Wales has been exceptionally high - we are awaiting figures but recent daily totals are likely to be the highest since the late 2000 floods (and possibly amongst the highest since 1947).

However, whilst floodplain inundations have been extensive and sustained, extreme flow events in individual rivers have been relatively uncommon (the relatively even distribution of the rainfall and the speed of passage of the low pressure systems are key factors in this spatial distribution).

Flood defences have generally performed well. Most flooding of property, to date, has been on sites constructed on floodplains or low-lying coastal locations. The most damaging flooding is normally local or regional in extent (the summer floods of 2007 in Yorkshire and South/Central England and the July/Sept floods of 1968) being examples of regional flooding. Recent weeks are most notable for the wide areal extent of notably high flows rather than record runoff in individual rivers.

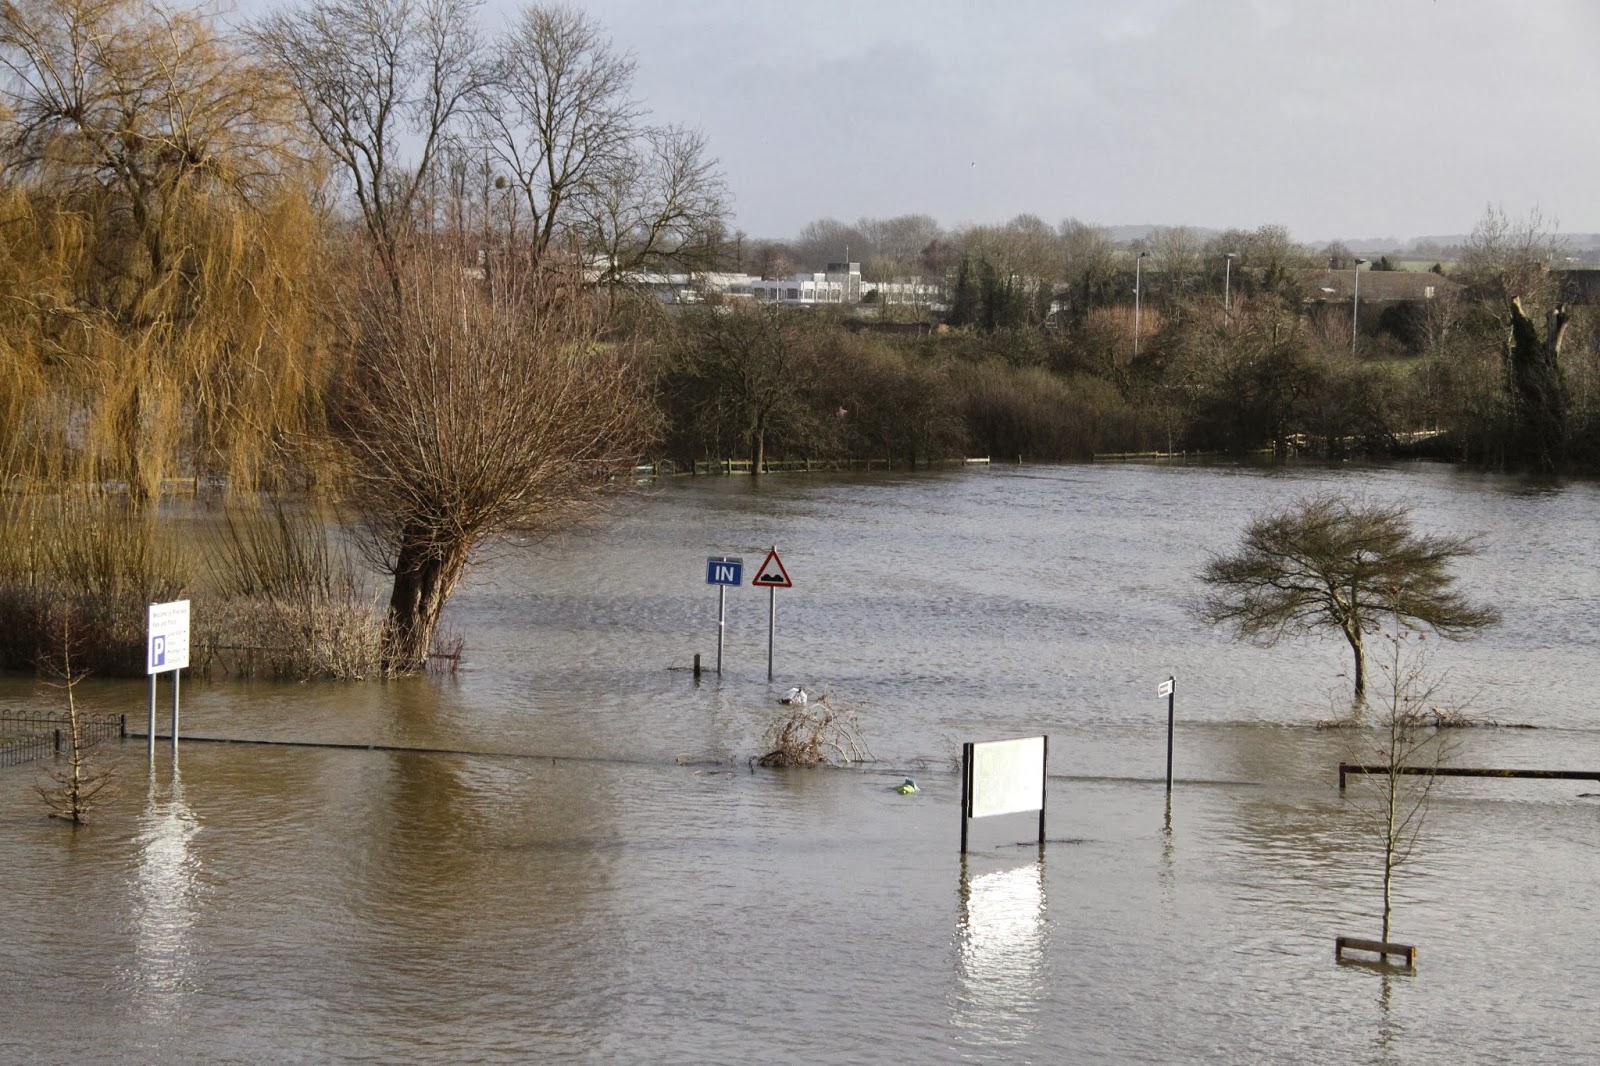
Floodplain inundations have been extensive.
Photo: Paulette Burns / Centre for Ecology & Hydrology


None of the flooding in the last 50 years matches that experienced in March 1947 when a warm front brought moderate rainfall and a rapid increase in temperature which melted snow accumulations of >30cm across much of England & Wales. At that time, flood defences were rudimentary. Such floods are less likely to occur in a warming world and, although the frequency of high flows has increased in the last 50 years, there is no compelling long-term trend in annual maximum flows for UK rivers.

However, with sea levels rising (exacerbated by isostatic re-adjustment in some regions), the type of fluvial/tidal flooding recently experienced may be expected more frequently in the future.  

With regard to the UK’s Water resources (which supply water for household and industrial use) the rainfall in December and early January has ensured that reservoir stocks are above average across almost all of the UK and groundwater levels have generally risen rapidly over the last six weeks. The water resources outlook for 2014 is therefore very healthy.

Terry Marsh, Centre for Ecology & Hydrology, 6 January 2014

Additional information


Key floods publications from CEH

Report - The 2010-12 drought and subsequent extensive flooding [PDF]
The section from pages 44-47 covers recent decades in the context of long-term trends for rainfall, runoff (river flows) and groundwater levels.

Report - The Summer 2007 floods in England and Wales [PDF]

Report - The 2000/2001 floods

Briefing Note - Understanding Floods [PDF]

Related links

CEH Blog: Rainfall, UK floods and the potential impacts of climate change?

Flickr: Photos of January 2014 flooding in Wallingford, Oxfordshire


*The National Hydrological Monitoring Programme (NHMP) aims to provide an authoritative voice on hydrological conditions throughout the UK, to place them in a historical context and, over time, identify and interpret any emerging hydrological trends. Such information is essential for improved water management strategies and its dissemination helps to increase public understanding of hydrological and water resources issues.

This is accomplished through regular monthly and annual bulletins, occasional reports on floods and droughts, and engagement with the media. Hydrological analysis and interpretation within the programme is based on the data holdings of the National River Flow Archive and National Groundwater Level Archive, including rainfall, river flows, borehole levels, and reservoir stocks.

The NHMP is run with the cooperation of the principal Measuring Authorities of the Environment Agency (England), Natural Resources Wales, the Scottish Environmental Protection Agency, and the Rivers Agency (Northern Ireland).

Amongst the NHMP outputs are:


NB: This post was edited on 9 January 2014 to include a new photograph of the flood level mark at Wallingford Bridge. All photos indicating the rising flood levels are available on our Flickr set.