Showing posts with label rivers. Show all posts

Wednesday, 18 February 2015

New dataset released: Integrated Hydrological Units of the United Kingdom

Our colleagues in the National River Flow Archive (NRFA) have released a new, freely available dataset of spatial reference units for hydrological purposes, called "Integrated Hydrological Units of the United Kingdom". Filip Kral explains more:

"This dataset will aid hydrological analysis and water management in the UK by providing a consistent, nationwide framework for segregating river catchments into component parts. It also serves as a reference list of major river names and, by indicating which units are connected, it can be used to trace the flow of rivers across the country.

The Integrated Hydrological Units (IHU) of the United Kingdom (UK) define spatial geographical reference units for hydrological purposes

Researchers and organisations working to improve catchment management have already expressed interest in the dataset which we believe will become popular in the water industry and wider hydrological science community, thanks also to its open data license.

Integrated Hydrological Units (IHU) of the United Kingdom (UK) consists of four polygon layers: Hydrometric Areas, Groups, Sections, and Catchments. Each layer represents a different level of spatial detail.

  • The coarsest level, Hydrometric Areas, consists of more than 100 polygons corresponding to the spatial units used to organise river flow measurement and hydrometric data collection in the UK (for example, HA023 represents the Tyne in Northumberland). 
  • Each Hydrometric Area consists of one or more Groups (405 in total), which carry names derived from the major rivers flowing through, in, and out of each group, for example HA023G03 is Tyne (North Tyne to tidal limits) Northumberland. 
  • Each Group consists of even smaller units – Sections (more than 500,000 in total). A Section is the drainage area of a watercourse between two confluences, for example HA023G03S0024 is Tyne (Devil’s Water to March Burn). 
  • Each Section is associated with one Catchment representing the compound catchment upstream of the Section outflow point.
Tyne Bridge, Newcastle

Historically, Hydrometric Areas were the primary reference units used by the NRFA to manage hydrometric data in the UK. IHU is a new release of the Hydrometric Area definition supplemented with finer scale units, all derived using the CEH Integrated Hydrological Terrain Model. Plans are being developed to utilise the IHU to help users explore other datasets produced by the NRFA and CEH’s Environmental Information Data Centre."

The dataset is available on the EIDC Hub.

Filip Kral

Related links


National River Flow Archive

EIDC Hub


Monday, 29 September 2014

Flu study offers unique insight into our drug habits during a pandemic

New research led by CEH’s Dr Andrew Singer provides the first evidence of how the use of antibiotic and antiviral drugs became elevated during the 2009-2010 influenza pandemic in the UK. The study, published in PLOS One, offers a unique look at public health practice, human behaviour and drug adherence in the country.

Andrew’s study, carried out at 21 locations within the river Thames catchment, was the first to provide actual measurements of antibiotics, antivirals and decongestants in sewage effluent and receiving rivers during an influenza pandemic, an event only likely to happen every 30 years or so. The aim was to quantify the pharmaceutical response to the pandemic and compare this to drug use during the late pandemic and the inter-pandemic periods. The findings helped to quantify the risk to wastewater treatment plants, as they will be sensitive to the amount of antimicrobials in sewage and could potentially fail to meet water quality standards during high drug use events such as an influenza pandemic.

Dr Andrew Singer at work in one of CEH's laboratories.

The study also provides evidence that environmental concentrations of the antiviral Tamiflu would be sufficiently high to select for antiviral-resistance in influenza viruses within wildfowl inhabiting the river Thames. Future research will need to focus on the minimum concentration of antibiotics needed to ‘knock out’ a wastewater treatment plant, and whether this concentration could be achieved during a more severe pandemic. It remains an open question as to the extent to which exposure to high concentrations of Tamiflu have actually selected for antiviral resistance in wildfowl—as this has been shown to occur in laboratory studies. Lastly, it also remains unclear as to the lasting impact of an increase in antibiotic use during a severe influenza pandemic on the environmental reservoir of antibiotic resistance and its relevance to human health. Will we need to limit antibiotic use during a pandemic in order to spare our wastewater treatment plants as well as the long term efficacy of antibiotics?

Read more about the background to the study in an article on Andrew’s blog and read the freely available study in PLOS One.


Additional information


Staff page of Dr Andrew Singer, CEH

Andrew led a previous study estimating how much prescribed Tamiflu went unused during the 2009-2010 pandemic. More details in a CEH news story.


Thursday, 21 August 2014

CEH scientists collaborating with global freshwater citizen science programme

CEH scientists working on a project investigating water pollution in urban areas have teamed up with Earthwatch to train citizen scientists in carrying out water quality monitoring. The collaboration has come about via Earthwatch’s Freshwater Watch programme, which aims to study fresh water quality around the globe by engaging employees from participating organisations as citizen scientists.

The POLLCURB project, led by CEH, is looking at how water pollution relates to change in urban areas, in particular change brought about by population growth, and what it may mean for water quality and quantity in the future.

POLLCURB is collaborating with the Earthwatch programme by training citizen scientists, in this case employees from Shell, to monitor water quality in the river Thames and two of its tributaries, the Mole and Ember, using a handheld multiparameter probe.

CEH's Mike Hutchins (centre) teaching participants
how to use the probe. Photo: Richard Sylvester / Earthwatch.

Dr Mike Hutchins of the Centre for Ecology & Hydrology is lead investigator on POLLCURB. At a recent citizen science training day at Wimbledon Common, Mike gave an overview of the project before teaching the budding citizen scientists from Shell how to use the monitoring probe, taking them into the field to gain first-hand practice.

Probe dunking. Photo: Richard Sylvester / Earthwatch.


The participants will visit the Thames sites several times over the next six months to collect data on temperature, turbidity, organic matter, algae and oxygen levels, producing a monthly dataset for each location. As well as collecting data for POLLCURB, they are also carrying out Freshwater Watch’s global parameters at each of the sites, which include collection data on nutrient levels.

Looking at the data collected. Photo: Richard Sylvester / Earthwatch.

Mike told us a little more about the value of the collaboration. He explained, "As POLLCURB is investigating how urban growth influences local water bodies I am keen to get people living in those very towns and cities involved and, in particular, for them to have the opportunity to use some of the equipment that professional scientists are currently using on a day-to-day basis.

"The data the citizen scientists are collecting will benefit me, in terms of improving the models I am using to predict river water quality, and also regulators, who will gain further knowledge of some specific rivers of interest to them."

Looking at results. Photo: Richard Sylvester / Earthwatch

Mike added, "The project with Earthwatch / Shell is flexible and I hope will gain some of its own momentum. There is potential to expand the number of sites or increase the frequency of visits, and also I am particularly enthusiastic about the scope for participants to monitor other local water bodies in which they may have a particular personal interest."

Earthwatch and CEH collaborators at one of the monitoring sites on the
Thames near Hampton Court. Photo: Mike Hutchins / CEH.


For more detailed information on the POLLCURB project, visit the project website.

Additional information


FreshWater Water has already recruited more than 1700 citizen scientists in over two dozen cities around the world. Data collected are uploaded to freshwaterwatch.thewaterhub.org

Staff page and research interests of Dr Mike Hutchins, CEH

More about the citizen science training day from Earthwatch

Posted by Paulette Burns, Media Coordinator

Friday, 25 July 2014

Royal Meteorological Society members visit CEH

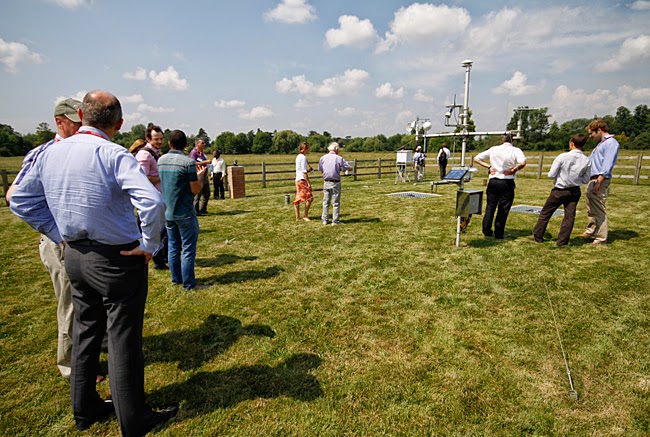
Members of the Royal Meteorological Society's Meteorological Observing Systems Special Interest Group have paid a visit to CEH to learn more about aspects of our monitoring work. The visitors were given a tour of our Meteorological Station at Wallingford (thankfully the weather was warm and sunny at the time!) and also heard more details about its history and observations from site manager Katie Muchan:


The visitors also heard a presentation from Dr Gareth Old about CEH's River Lambourn Observatory and research into chalk river systems:


Dr Jonathan Evans of CEH also presented on progress and early results from COSMOS-UK, the UK soil moisture monitoring network. The network will deliver real-time weather monitoring and field scale measurements of soil moisture across the United Kingdom.

Members of the RMetS Special Interest Group on Meteorological Observing Systems visit
CEH's Wallingford Meteorological Station, July 2014. Photo: Paul Fisher/ CEH


Further reading


Winter 2013/2014 rainfall records at CEH's Wallingford meteorological station 

A window on weather conditions at Wallingford

Sunday, 9 February 2014

Record breakers? Climate change, statistics and the recent UK floods

This morning the Met Office and the Centre for Ecology & Hydrology released a report on the recent storms and floods in the UK.

You can read the full report here, and a short summary of the hydrological analysis on our website here

The report documents the recent record-breaking weather and flooding episode, and discusses whether climate change contributed to the severity of the weather and its impacts. Climatology, meteorology and hydrology are covered in the report. 

In this blog post we highlight some of the hydrological conclusions that came from analysis of the long-term datasets held at CEH and our long history of research into floods.

With regard to the record-breaking nature of the flooding the report makes the following points:


  • The full gamut of flood manifestations – tidal, pluvial (flash), fluvial and groundwater – has been experienced over the last eight weeks.
  • The exceptional run of severe winter storms over December 2013 and January 2014 carried with them large amounts of rain which has led to very serious flooding across southern England. 
  • Estimated outflows (river flows) from Great Britain remained close to the highest ever recorded during late December and, subsequently, throughout most of January across large parts of England and Wales.
  • In a series from 1883, flows on the River Thames at Kingston (close to the tidal limit) remained above 275 m3 s-1 for longer than in any previous flood episode, and continue to exceed this threshold into early February. 
  • A preliminary analysis suggest that outflows aggregated over six weeks were the greatest since the 1947 floods – the most extensive in England & Wales during the 20th century.
  • In December and January, a few rivers (including the Mole, Wey and Medway, which, on the basis of preliminary data, recorded their highest flows since the extreme floods of September 1968) registered outstanding maximum flows. 
  • Generally, however, the peak flows registered during the recent flooding were not extreme. On the Thames the highest flow in 2014 has been exceeded during 14 earlier floods (most prior to 1950). 
  • The floodplain inundations across the UK caused major disruption to transport, agriculture and restricted sporting and recreational activities, and resulted in severe difficulties for some low-lying hamlets (most notably in the Somerset Levels). However, given the overall volume of runoff, the amount of property flooding at the national scale was relatively modest; a tribute to the general effectiveness of flood defences.


Figure 1: Combined flows (m3 s-1; black) for the Thames, Severn, Trent, Yorkshire Ouse and Usk in 2013 and January 2014, plotted against period of record (1969-2013) daily maximum flows (blue), daily minimum flows (pink) and daily mean flows (grey)

With regard to whether climate change has been a contributing factor to the current flooding the report states:


  • The cluster of drought and flood events through the early years of the 21st century and the recent runoff and recharge patterns, are near to the extreme range of historical variability, and therefore also raise the question that they may reflect anthropogenic climate change. It is important to note, however, that differing flood types may be expected to respond differently to increasing temperatures. Tidal flood risk is increasing as sea levels rise but the outlook is more complex in relation to fluvial flooding.
  • Published studies have observed increased river flows in the winter half-year and a tendency for higher flows to occur more frequently, and this has been reinforced in recent years. Importantly, however, such a trend may not be accompanied by any increase in magnitude of major flood events. In the UK, no positive trend in water-year maxima was found in the 130-year series for the Thames.
  • Enhanced groundwater flood risk may be expected if average winter rainfall in the UK increases. Flash flooding, which can be exacerbated by land management and land use practices (particularly the extension of impermeable areas), may also increase if the recent intensification in rainfall translates into an enduring trend. 
Much more detail can be found in the full report. More information about the report's conclusions is available on the Met Office website here.

Journalists can call our Press Office if more information is needed on the hydrological conclusions.

Barnaby Smith, CEH Media Relations Manager

Further links

Jamie Hannaford from the Centre for Ecology & Hydrology contributed a chapter to the Living with Environmental Change climate change report card for water entitled, "Observed long-term changes in UK river flow patterns: a review"


An interim update on the UK's hydrological situation - issued by CEH on 6 January 2014

Rainfall, UK floods and the potential impacts of climate change? - blog from 6 January 2014

NB: the Met Office updated the report on 11 February to give a more detailed assessment of sea level rise

Thursday, 6 February 2014

How exposed are the world’s rivers to pollutant chemicals discharged from domestic sources?

CEH scientists Andrew Johnson, Virginie Keller and Richard Williams blog about their new paper examining pollution in the world’s rivers.

All around the world we use more and more chemicals in toothpaste, drugs, shampoo, hormones for cancer treatment and as a means of contraception. All these chemicals go "down-the-drain" and a proportion escape from sewage treatment plants before entering rivers and potentially affecting wildlife. A good example is the issue of sex hormones discharged by the human population resulting in male fish displaying female characteristics (e.g. egg proteins in their blood, egg sites in their testes), which caused alarm around the world.

One way of finding out the scale of national exposure to such chemicals is to get chemists to test for every chemical in every river in their country. Such monitoring campaigns are extremely challenging and very costly to carry out. Even in countries such as the UK, which has a small geographical area and leads the world in environmental monitoring, the level of effort required is difficult to sustain. For developing nations the expense of such monitoring campaigns means such information and knowledge is beyond reach.

Our new study, recently published as an open access paper in the journal Environmental Toxicology and Chemistry, used a geographic-based model which compares population with river flow to assess the available natural dilution for the human wastes that contain chemicals. The less dilution available within a nation, the higher the exposure levels to these chemicals will be.

As we all know rainfall patterns can vary dramatically throughout the year, and from year to year. The model used long-term annual and monthly averages of river flow (based on up to 60 years of measured rainfall) to generate a range of dilution factors.

Many nations have poorly populated and densely populated regions. Thus, for each nation, a variety of dilution factors were examined (expressed as a range of percentiles). The spatial variability of the dilution factors can vary considerably depending on the percentiles – defining low to high flows – and types of flow considered (annual or monthly).

Predicted values of national annual median (50%ile) dilution factor

The results are interesting. In Europe, the UK median dilution factor of 37 puts it in the upper third of nations exposed to domestic chemicals. However, the 25%ile results – a measure of low flow dilution – give the UK a dilution factor of only 6, making it the most exposed country. This is a consequence of our relatively dry summers and high population densities in the South and Midlands. By way of contrast the French median dilution factor is 76 and 25%ile dilution factor is 47. This tells us that French fish have a lot less to worry about than British fish!

The paper is open access so readers can look up their exposure to chemicals by examining the tables we’ve created. We hope that environmentalists and regulators from countries across the world, as well as the general public, are able to use the results, to better address this important issue.

Andrew Johnson, Virginie Keller and Richard Williams

Additional information


The full paper reference is:

Keller V.D.J., Williams, R.J., Lofthouse, C., Johnson, A.C. (2014). Worldwide estimation of river concentrations of any chemical originating from sewage-treatment plants using dilution factors.
Environmental Toxicology and Chemistry, 33, 447-452. doi: 10.1002/etc.2441

Staff page of Professor Andrew Johnson

Staff page of Richard Williams


Friday, 28 June 2013

CEH contributes to new BES report on impact of extreme weather events on freshwater ecosystems

Dr Linda May and Dr Francois Edwards recently led the CEH input to a British Ecological Society Centenary report on the impact of extreme weather events on freshwater ecosystems. The report was launched at a special reception on Tuesday 25 June 2013 at Westminster.

Lake and river ecologists from across the Centre for Ecology & Hydrology were involved in contributing to the report, which aims to provide more information on the problems that floods, droughts, heatwaves etc present for freshwater systems, affecting water quality and quantity.

The launch event was attended by more than 100 people and included speeches from Andrew Miller MP, BES President Professor Georgina Mace and Huw Irranca-Davies MP, who officially relaunched the BES Ecological Issues series, which the new report has been published within.

Earlier in the day Dr Edwards helped run a workshop based on the report at the "Future Water 2013 Building resilience:  A sector fit for the future" meeting at the Royal Geographical Society.

To accompany the full report, a short 2-page summary and policy brief was also published.

Read the full report: The Impact of Extreme Events on Freshwater Ecosystems (7.40mb, PDF from the BES website)

More about the launch event can be read on the British Ecological Society blog.

Executive summary and policy brief

Additional information


RGS meeting agenda

Staff page of Dr Francois Edwards, CEH